As cliche as it is to use Murphy’s Law, it’s appropriate when describing the recent days of Panthers football: Anything that can go wrong will go wrong.
In the third year of the Matt Rhule era, the team has yet to show any signs of playoff fire. No stat offers more proof than one you’ve likely seen circulating across the internet: Rhule’s Panthers are 1-26 in games where they allow 17 points or more (The one win? A 31-21 victory over the Cardinals in 2020).
This includes 24 consecutive losses in said games.
As much as the head coach preaches about accountability and fixing what is broken, time is on the cliff’s edge. With a 1-3 start despite housing plenty of promising pieces to the roster, the assumption is that Rhule’s job is on thin ice.
These next three games make Rhule’s chances of saving his job no easier. They’ll face the 49ers (home of one of the league’s most well-coached defenses), the Rams (Aaron Donald), and the Buccaneers (4th in defensive snap by snap efficiency, or DVOA, via Football Outsiders).
For fans looking to forget the hells of 2010, the same dead end street has apparently appeared 12 years later.
Now, the question is: Have the Panthers improved in any category since Rhule’s arrival? Where have they consistently gotten better or worse? To answer that, I present a State of The Union, a review of where these cats rank in statistical categories both raw and advanced.
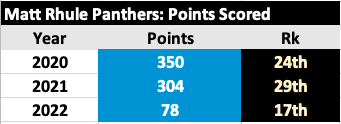
First, let’s take a look at points scored. Teddy Bridgewater’s 2020 squad ranked 24th, and while the team was featured in a number of close games, their track record in these indicated a team that wasn’t ready but was making progress. Unfortunately, the arrival of Sam Darnold only made the team take two steps back, as they finished with the third worst point total.
Through four weeks this year’s team seems to be improving in scoring, but a pair of defensive touchdowns inflates the 17th ranked Panthers. Next, let’s take a look at yards.
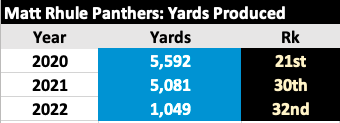
Using yards to measure offensive quality normally misses the big picture, but in this case it does accurately paint how the team’s efficiency has gradually taken a nosedive. That’ll happen when you use three offensive coordinators in as many seasons.
For a more detailed expression of the team’s efficiency, let’s take a look at Yards Per Play.
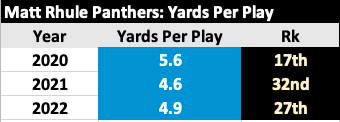
Once again, Bridgewater’s Panthers found themselves in the middle of the pack: Joe Brady’s schemes did a semi-decent job of creating production out of its players. The same could not be said for 2021, resulting in the abrupt firing of Brady. The 2022 Panthers still have a large inability to produce yards per play, but at least they’ve made a small improvement in this category (32nd to 27th).
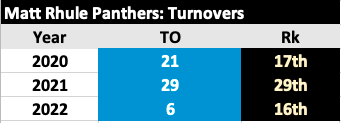
As with any Sam Darnold offense, the 2021 Panthers had a severe case of turnovers with the fourth most last season. Teddy Bridgewater’ game manager-esque style of play guaranteed the team wouldn’t finish with too many of those, and this year’s team just has six through four games. Of course, this is offset by the team consistently going three and out.
Speaking of which…
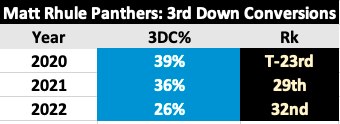
The biggest cardinal sin of the Matt Rhule era has been the team’s inability to convert third downs. Impossibly, it’s gotten drastically worse each year. Currently the team’s 26% conversion rate is dead last in the league, and it seems the further the team invests at the quarterback position, the worse the team is at moving the chains.
Indeed, that holds true, and it’s gone from 21st in 2020 (335), to 322 in 2021 (25th), and 56 through four weeks in 2022 (dead last). Ben McAdoo’s scheme has little incentive to convince fans that he is an improvement over Joe Brady.
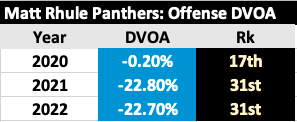
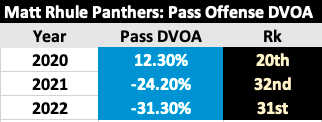
Here we’ll be taking a look at offensive DVOA (Defense-adjusted Value Over Average), which looks at a team’s efficiency on a snap-by-snap basis. Based on how these charts have gone, it should come as no surprise that the efficiency is lacking. The team was average in 2020, and atrocious in both 2021 and 2022.
Below we’ll take a look at both the team’s pass and rush DVOA in addition.
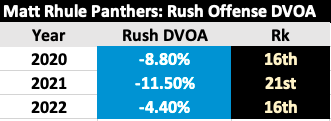
The rush efficiency has been friendlier than the pass – a healthier Christian McCaffrey and revamped offensive line has resulted in improved run blocking, which obviously makes all the difference for a talented back such as CMC.
But looking at the passing efficiency, it almost looks like the results from an entirely different team. If I knew what was to follow I’d praise the team’s 20th ranking in 2020 on the level of the 2015 squad. Baker Mayfield’s complete lack of comfort in another offense (Rhule is his fifth coach in as many seasons) is destroying that side of the ball, and as the pass DVOA indicates.
Mayfield’s numbers have also been atrocious. He’s 30th in passer rating (75.0), dead last in ESPN’s QBR statistic among non-benched starters (15.3), 26th in yards per attempt (6.4), and 27th in adjusted net yards per pass attempt (4.76).
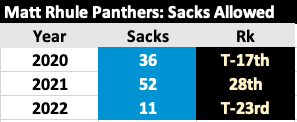
It’s easy to blame the offensive line for Mayfield’s disastrous numbers, and indeed the team’s 11 sacks allowed are a lot (the team is on pace to allow 47 sacks). However, looking at advanced numbers indicates something is very much wrong with Carolina’s new quarterback.

ESPN’s Pass Block Win Rate metric takes a look at if a lineman can hold a block for 2.5 seconds or longer. If they do, they’ve won their rep and added to their win rate. Anything less than 2.5 seconds results in the opposite. With that said, let’s dive into these numbers.
This season, the offensive line is the best it’s ever been under Rhule, as the team’s 62% Pass Block Win Rate is 12th thus far. The investment in players such as Ikem Ekwonu, Brady Christensen, Pat Elflein, Bradley Bozeman, and Austin Corbett alongside Taylor Moton have paid off after some early struggles. Ekwonu in particular has settled in after going through the ringer in a career debut against Myles Garrett.
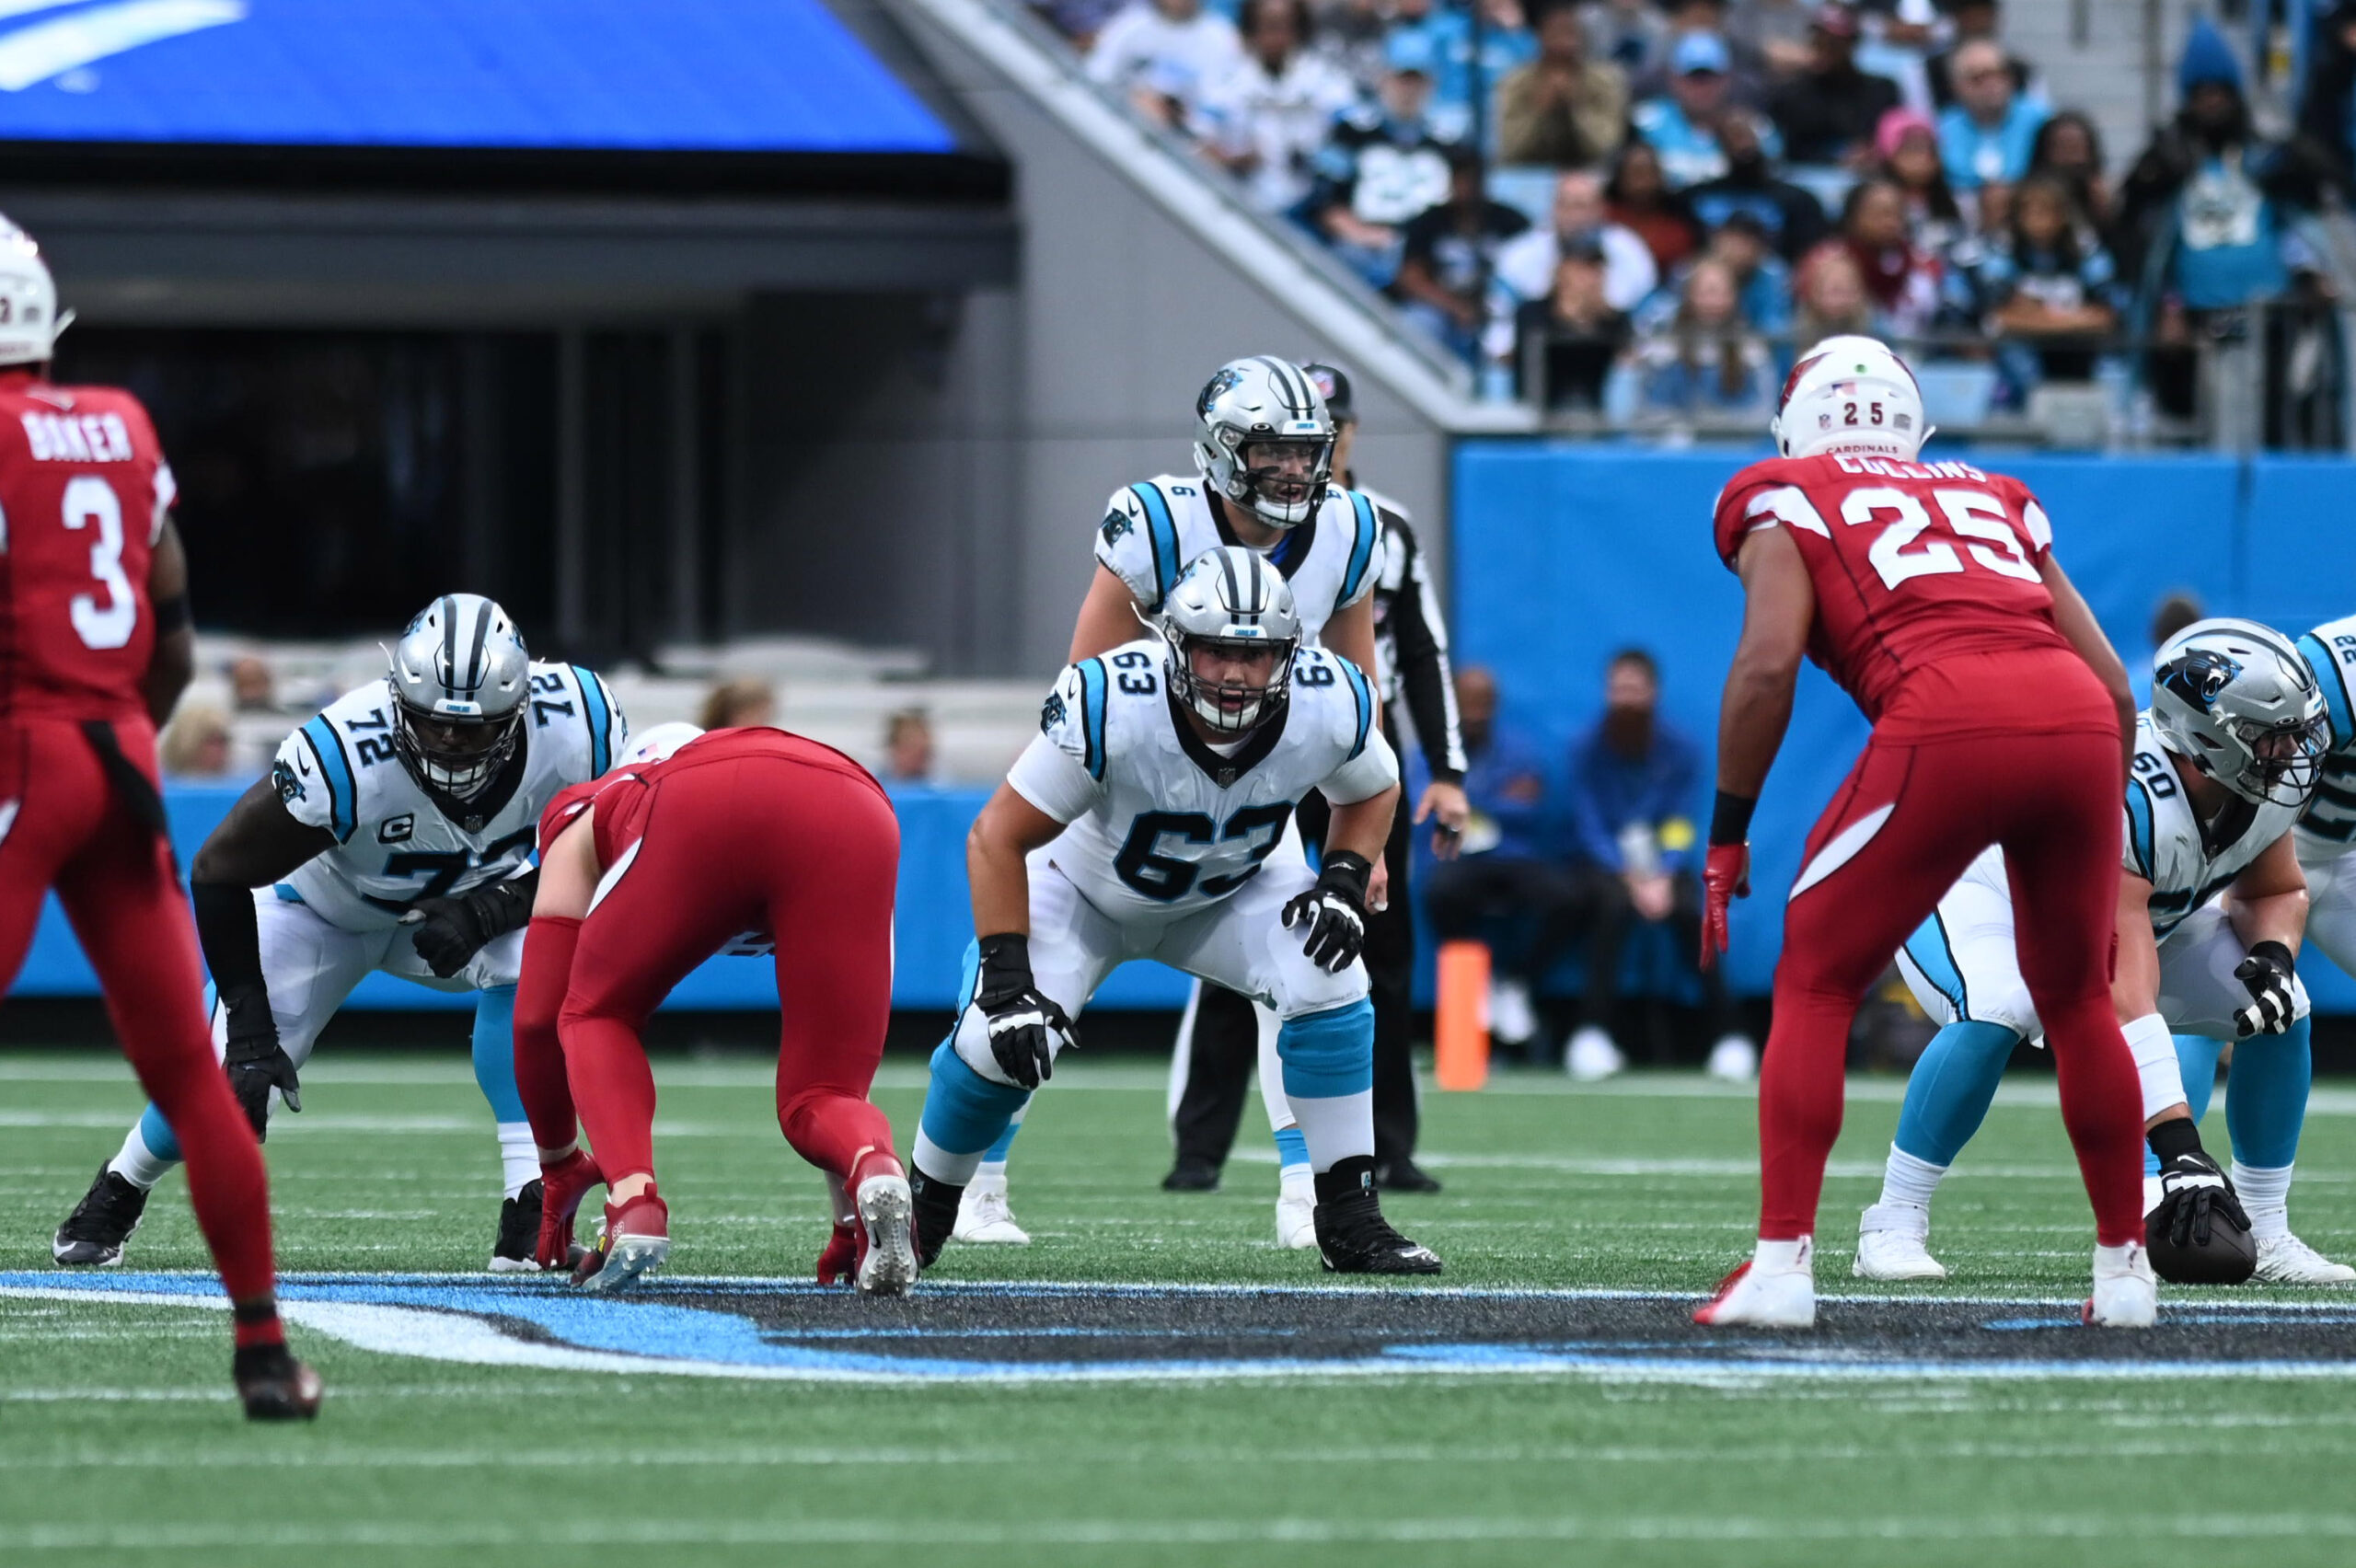
This does not make Mayfield look good. What it tells us is he’s created much of the pressure since his arrival. Too many times he drifts from the pocket and leaves clean protection, rolling out and arriving directly into defenders’ laps. It’s a problem that existed throughout his entire career in Cleveland, and it hasn’t diminished in Charlotte.
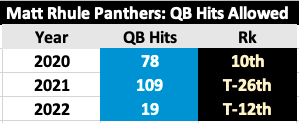
Mayfield isn’t getting hit often either, as the team’s 19 quarterback hits are tied for the 12th fewest allowed. The combination of Darnold and Cam Newton getting lit up prompted a rehaul up front, and though it’s paid off thanks to improved protection, the quarterback has to reward his guys for doing so.

On a more positive note, McCaffrey is taking advantage of the team’s efficient run blocking, as they are tied for fourth in Run Block Win Rate. Outside of an abysmal showing in 2021, Rhule’s offensive lines have held up well as run blockers. While running isn’t as valuable as the pass, Rhule clearly wanted the team’s identity to be built around McCaffrey. Besides, we’ll take any victories we can get.
We’re in the home stretch, so let’s take a look at a few advanced stats from Pro Football Reference so we can further compare the efforts of Teddy Bridegwater, Sam Darnold, and Baker Mayfield during their time as Panthers.

This chart quantifies Average Depth of Target, or aDOT. aDOT takes a look at the average depth where the quarterback throws beyond the line of scrimmage. For example, let’s say a quarterback throws 10 passes in one game, and on all 10 of those passes he threw 7 yards beyond the line of scrimmage. As a result, his aDOT is 7.0.
With that in mind, the Panthers’ complete lack of a vertical pass attack is frustratingly apparent the further we get in the Rhule era. One receiver that’s felt the impact of this is D.J. Moore, whose 8.3 aDOT in 2022 is the lowest in his entire career. The combination of a lack of scheming downfield and a quarterback unwilling to take those shots has doomed whatever chance of an explosive downfield game this team has had.

Next, let’s look at On Target Percentage. True to its name, it measures the percentage of a quarterback’s throws that were on target, regardless if the pass was caught or dropped.
Despite having the lowest aDOT of the three quarterbacks, Mayfield also has the lowest On Target Percentage. Teddy Bridgewater had plenty to complain about, but overall accuracy was not one of them. These numbers dipped under Darnold, and have continued to devolve under Mayfield, who’s shown a laundry list of errant misses in the first quarter of the season.
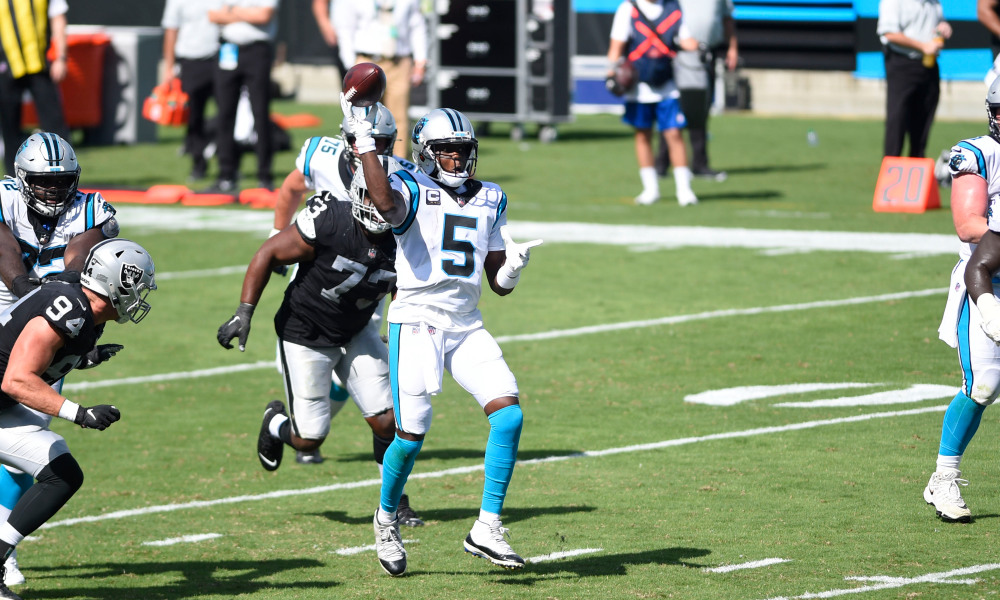
Sep 13, 2020; Charlotte, North Carolina, USA; Carolina Panthers quarterback Teddy Bridgewater (5) throws a two point conversion in the fourth quarter at Bank of America Stadium. Mandatory Credit: Bob Donnan-USA TODAY Sports
Finally, let’s look at Bad Throw Percentage. Excluding throwaways, these look at plays considered to be bad decisions by PFR.

Bridgewater threw the lowest (35th means last) percentage of bad throws of any quarterback according to PFR, a rate that rotted under Darnold. Mayfield’s discomfort has resulted in even worse rates, which in theory should regress the more he plays in this environment and continues to heal in his non-throwing shoulder. That, unfortunately, is easier said than done.
The team’s efforts to find the Cam Newton replacement have been aggressive, but it seems the more they add, the worse the offense gets. And it’s a shame because this team is home to a number of quality pieces. The defense has some playmakers that make the Thieves Avenue moniker proud, and the offensive line is playing at a level we haven’t seen in a while.
The team’s shortcomings this season stem from three areas: Matt Rhule, Ben McAdoo, and Baker Mayfield.
Rhule’s inability to make this Panthers team a playoff contender could make him the first coach in the franchise’s history without a season at .500 or above. Mayfield has played arguably like the worst quarterback in the league, but poor route combinations and inefficient schemes from Ben McAdoo have the offense playing six feet under.
At some point the Panthers have to do something. The clock is ticking, and the holes are only getting deeper. The lack of an efficient offense is inexcusable with the resources poured in. If it is to continue, at some point, someone is going to pay the price.

