
The NFL is a “what have you done for me lately” league, and of all the positions on the roster, kicker is possibly the ficklest in terms of how players are viewed by fans. Fans expect kickers to make field goals and, while there might be a bit of excitement around a kicker when they make a game winner or an improbable effort from north of sixty yards, generally the only time fans notice kickers is when they miss.
Because of this, it’s often hard to get much of a perspective on how good different kickers actually are, and while a cursory glance at a player’s field goal percentage can tell part of the story, it should be fairly obvious that this alone is not an accurate reflection of how valuable a kicker can be. This is something that Joey Slye mentioned when talking to the media during OTAs
“I think statistics obviously play a little bit of a role” acknowledged Slye. “If you’re 50% on your field goals, then you’re probably not doing very well and if you’re 100% you’re doing really well. I think they also can lie at certain points. If someone’s 80% and they’re hitting a bunch of long field goals all the time and if someone’s 95% but all their field goals are within 40 yards; it’s a little bit of a difference in statistics.”
With that in mind, and to try and bring a tiny bit of order to the world of NFL kicking, I wanted to try to delve into the data to try and find a more effective metric to judge kickers by than field goal percentage. So, what can be achieved with a little bit of data manipulation?
When a kicker makes a 60-yard field goal, that is really impressive, but when they make a 20-yard field goal that’s just not something that makes much of an impression.
Of course, you would rather the kicker make the 20-yard field goal than miss it, but making that 20-yard field goal is not very valuable. This is really the first challenge that has to be overcome, creating some means of assessing the value for different distances, and to do so in any meaningful sense requires historic data.
To do this then, I have taken every single non-blocked regular season field goal attempt from 2016 to 2020 and used them to calculate the NFL average field goal percentage at a given distance. I have ignored blocked field goals because as often as not they are not the fault of the kicker, and going back and watching each one and trying to assess blame and include only those attributed to the kicker would be both a lengthy process and a distinctly arbitrary one, and as the number of blocked field goals is relatively small as a percentage of all field goal attempts, no significant inaccuracy should result from their lack of inclusion.
However, while looking at quite so many field goals does allow for a fair amount of averaging, it is still the case that using the raw historic data as a guide leads to some logical qualms. For example, NFL kickers seem to have been notably worse at 34-yard field goals over this period than either 33- or 35-yard field goals, and are far better at 51-yard field goals than either 50- or 52-yard field goals. If we are to generate a value system that satisfies the basic assumption that field goals get harder the further away they are, then we cannot use the raw data.
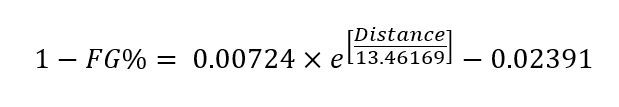
Instead, we need to fit this historic data to generate an equation for the distribution than can then be applied to any distance of field goal. To do this, the historic data was plotted as (1-FG%) as a function of the distance. Here (1-FG%) was chosen in order to give a value that increases as FG% decreases, and therefore increases as field goals get more difficult, mirroring the desired value metric. This plot was then fitted with an exponential to give the following:
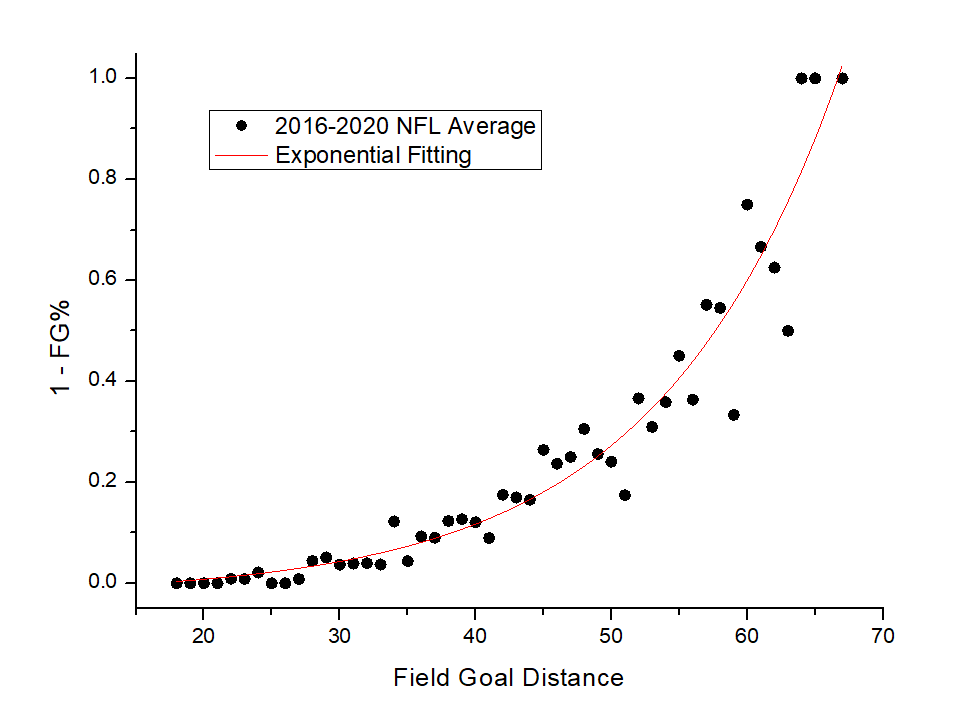
The equation of this exponential is given by the following equation, with an additional limiting condition of no distance able to have a value greater than 1:
Now, not everybody loves an equation, but what this essentially means is that field goals get more valuable the further they away they are, and the rate at which they become more valuable also increases as the distance increases. For reference, if a 20-yard field goal has an arbitrary value of 1, this would give a 30-yard field goal a value of 5.36, a 40-yard field goal a value of 14.54, a 50-yard field goal a value of 33.82 and a 60-yard field goal a value of 74.34.
This now gives us a way to weight the values of different distances of field goals, but what exactly can we do with this information?
Aug 16, 2018; Green Bay, WI, USA; Green Bay Packers kicker Mason Crosby (2) during the game against the Pittsburgh Steelers at Lambeau Field. Mandatory Credit: Jeff Hanisch-USA TODAY Sports
So, with an equation to generate a rough value metric for field goals, we can then look to compare different kickers. To do this, we are initially going to look at two different values: efficiency and value per kick attempt.
Efficiency is how we are going to describe the rate at which a kicker converts value. This is simply the sum of the value of all the kicks the kicker made divided by the value of all the field goals the kicker attempted. This is an equivalent of field goal percentage (only expressed as a fraction) but where each field goal isn’t counted equally, but rather in terms of the value of that field goal. Making a 60-yarder and missing a 20-yarder is therefore more efficient than making the 20-yarder and missing the 60-yarder.
Value per kick attempt looks to compliment efficiency by looking to quantify how difficult the average field goal that a kicker attempted was. If a kicker only attempts 50+ yarders then you would expect his efficiency (and his FG%) to be lower, but that isn’t because he is bad but rather because his average difficulty is greater. Kickers with very high values in this regard are consistently asked to attempt long field goals while kickers with smaller values were rarely asked to kick from much distance.
The results for every kicker to attempt more than 10 field goals in the 2020 season are shown in the following plot:
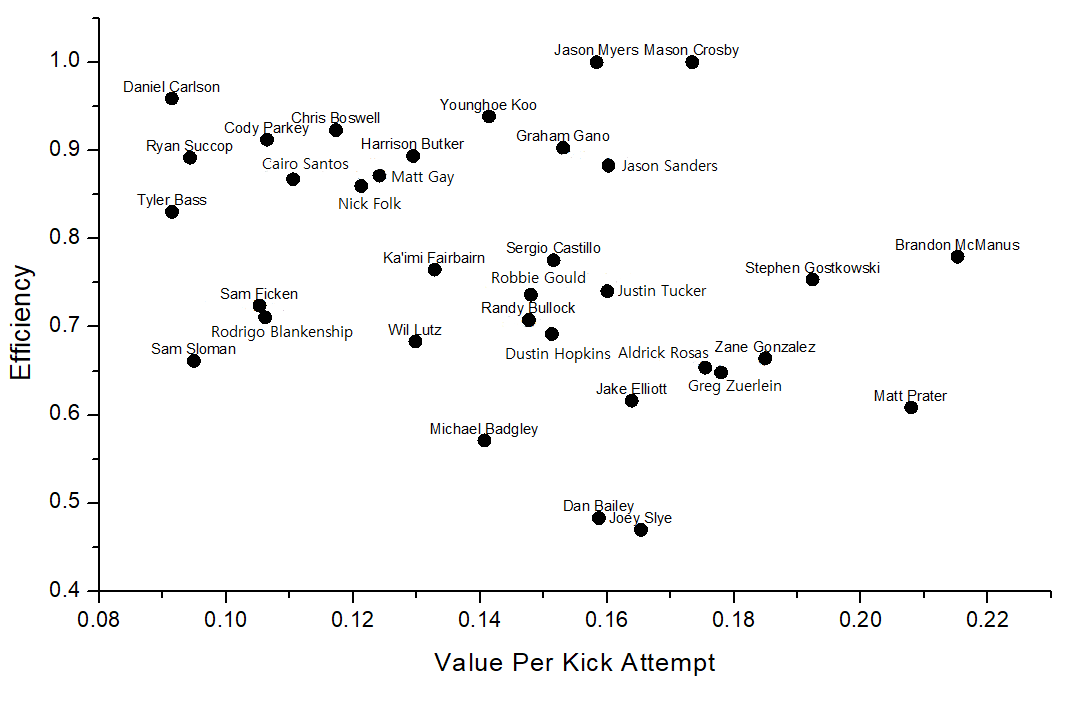
As you can see, the broad trend here is a diagonal line from the top left to the bottom right, which represents the fact that the further away you kick from the less efficient you are likely to be. The best kickers are those to the top right of the plot, while the worst kickers are those at the bottom left. As you can see, while Joey Slye was the least efficient kicker in the NFL last season, he was somewhat able to compensate for this by the fact that he worked at a pretty high degree of difficulty.
Of course, for a given season, there is still a significant luck and circumstance factor.

Joey Slye, for example, would have made a massive jump in efficiency if just one of his very long kicks had sneaked over, as there is no accounting for when a player gets very close. There is also an issue regarding how kickers are used by their teams, with Slye being an excellent example of this. In 2019, Slye was both more efficient than in 2020 and had a greater value per kick attempt; he would have been around where Stephen Gostkowski was in 2020; and yet his field goal percentage at different distances hasn’t really changed. This is because in 2020 he took far more 55+ yarders (nearly double as a proportion) where he is a below-average kicker and attempted far fewer from between 40-54 yards (just over half as many) where he is a notably above-average NFL kicker.
The Panthers obviously didn’t ask him to kick 55 yarders instead of 45 yarders on purpose, that was just the way the Panthers’ drives turned out, but it meant that he wasn’t used as efficiently or as effectively as he was in 2019. This is a reminder that this is a metric of performance, not ability, and that how a player is used has just as much impact on their value as how good they are.
Therefore, while we could look at value added per kick attempt (efficiency multiplied by value per kick attempt) to give us an indication of the most effective kickers in a given season, this would still a metric that is very sensitive to the usage of a kicker and so, if we want to be a little more detailed in our characterization of players, we need to delve a little deeper.

Having created our value metric, we have shown how this can be used to view players both in terms of the efficiency with which they convert the opportunities presented to them and the average difficulty of those opportunities, but what we’d really like to be able to do is to know whether a player is adding value based on the attempts they made.
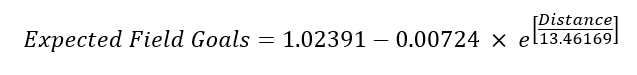
To do this we are going to introduce a new concept, the expected field goal. This is simply our value metric subtracted from one and represents the number of field goals that the average NFL player would make per kick attempted. In other words, if the NFL average field goal percentage at a given distance is a 95% then a field goal attempt from this distance would have an expected field goal value of 0.95. The equation for this is therefore given by the following, with the limiting conditions of being between 0 and 1:
But what is the point of looking at expected field goals?
Well, by calculating how many field goals an average NFL kicker would have made from the same attempts, one can calculate how many field goals more or less than the average NFL kicker a given player has made. Similarly, one can compare a player’s field goal percentage to the expected field goal percentage, or the field goal percentage an average NFL kicker should be expected to make from the same attempts.

From these, we can then calculate two final metrics: Points Above Expectation (PAE) and FG% Above Expectation (FG%AE). PAE represents the number of points the player added compared to an average kicker and is simply the number of made field goals minus the number of expected field goals, all multiplied by three. FG%AE is the field goal percentage minus the expected field goal percentage, where expected field goal percentage is trivially the number of expected field goals divided by the number of field goal attempts.
The reason for using both of these metrics rather than just one is that a player who attempts a very high number of field goals and who is notably above average will naturally have a very high PAE, but another player who is more efficient but who simply doesn’t attempt as many field goals will have a lower PAE but will have a higher FG%AE. It is also worth noting that these values are above expectation and not above replacement, so a player with a negative PAE is not necessarily worse than a replacement player but is just below the NFL average. This work doesn’t extend to trying to define what might constitute a replacement level NFL kicker.
So, who was the best kicker in the NFL in 2020?
EAST RUTHERFORD, NEW JERSEY – SEPTEMBER 14: Graham Gano #5 of the New York Giants kicks a field goal against the Pittsburgh Steelers during the first quarter in the game at MetLife Stadium on September 14, 2020 in East Rutherford, New Jersey. (Photo by Al Bello/Getty Images)
Well, in points above replacement it was Graham Gano, as while he was only third in FG%AE he was able to compensate for this with volume. In terms of FG%AE the leader was Mason Crosby, followed closely by Jason Myers, neither of who missed a field goal in 2020. Crosby only ranked 5th in PAE but given that he only attempted 16 field goals this is pretty remarkable as Graham Gano had to attempt double the number of field goals to add less than 3.5 PAE above Crosby.
Dan Bailey ranked last in terms of PAE, leaving more than 10 points on the field compared to the average NFL kicker, but was bested to the dubious double crown by Sergio Castillo who managed to kick nearly 16% below his expected field goal percentage, with Bailey second at just under 11% below average. Joey Slye did fall slightly below average in both categories, with a PAE of -0.64 and a FG%AE of -0.61%, but for all meaningful purposes was pretty much bang-average.

Photo Credit: Brandon Todd/Carolina Panthers
What is also noteworthy is that using these metrics we see a much stronger agreement between Slye’s 2019 and 2020 seasons, with 2019 Slye having a PAE of 0.22 and a FG%AE of 2.4%, again almost exactly in line with what would be expected of an average NFL kicker. The full results for the 2020 season are given in the following table:
| Name | PAE | PAE Ranking | FG%AE | FG%AE Ranking |
|---|---|---|---|---|
| Mason Crosby | 8.3252877386566 | 5 | 0.17344349455535 | 1 |
| Jason Myers | 11.40123047805 | 2 | 0.15835042330625 | 2 |
| Graham Gano | 11.696598654987 | 1 | 0.12183956932278 | 3 |
| Younghoe Koo | 10.546177522854 | 3 | 0.090138269426099 | 4 |
| Jason Sanders | 9.2669837318639 | 4 | 0.081289330981263 | 5 |
| Chris Boswell | 4.0382753637911 | 12 | 0.067304589396519 | 6 |
| Daniel Carlson | 6.3277033039086 | 6 | 0.062036306901064 | 7 |
| Brandon McManus | 5.6618298471615 | 7 | 0.058977394241266 | 8 |
| Justin Tucker | 4.9264425568146 | 8 | 0.056625776515111 | 9 |
| Harrison Butker | 4.4854556561225 | 10 | 0.055375995754598 | 10 |
| Nick Folk | 4.1872824852909 | 11 | 0.049848601015368 | 11 |
| Cairo Santos | 4.6139726385295 | 9 | 0.048062214984683 | 12 |
| Randy Bullock | 3.4071957475406 | 13 | 0.040561854137388 | 13 |
| Sam Ficken | 1.4218748830646 | 15 | 0.033854163882491 | 14 |
| Ryan Succop | 2.4879321383079 | 14 | 0.027643690425644 | 15 |
| Cody Parkey | 0.70617339693709 | 17 | 0.011209101538684 | 16 |
| Greg Zuerlein | 0.890721085933 | 16 | 0.0072416348449837 | 17 |
| Ka'imi Fairbairn | 0.35586703599077 | 18 | 0.0038265272687179 | 18 |
| Matt Gay | -0.041833357088571 | 19 | -0.00087152827267856 | 19 |
| Joey Slye | -0.63715659765444 | 20 | -0.0060681580728994 | 20 |
| Aldrick Rosas | -0.73493866112959 | 21 | -0.024497955370986 | 21 |
| Robbie Gould | -1.7884086514472 | 22 | -0.025918965963003 | 22 |
| Rodrigo Blankenship | -3.2183753779987 | 24 | -0.028994372774763 | 23 |
| Matt Prater | -3.5333814745012 | 25 | -0.042064065172633 | 24 |
| Wil Lutz | -4.0942641556208 | 26 | -0.048741239947867 | 25 |
| Tyler Bass | -4.3174196899498 | 28 | -0.051397853451783 | 26 |
| Dustin Hopkins | -5.5666938455411 | 29 | -0.054575429858246 | 27 |
| Stephen Gostkowski | -4.147888551835 | 27 | -0.05760956321993 | 28 |
| Sam Sloman | -2.5834323927379 | 23 | -0.071762010909385 | 29 |
| Zane Gonzalez | -5.794776389398 | 31 | -0.087799642263607 | 30 |
| Jake Elliott | -5.6571495758006 | 30 | -0.099248238171941 | 31 |
| Michael Badgley | -10.493071144377 | 33 | -0.10930282442059 | 32 |
| Dan Bailey | -10.524691681441 | 34 | -0.15946502547639 | 33 |
| Sergio Castillo | -6.5432866144347 | 32 | -0.18175796151208 | 34 |
PAE and FG%AE offer an opportunity to evaluate kickers based on how they perform with respect to an average NFL kicker, and while on a game-by-game basis the stochastic nature of field goals will lead to fairly significant fluctuations (as indeed is the case for FG%), over the course of a season these metrics should allow us to evaluate kickers in a way that conventional metrics do not. Crucially, the use of a fitting parameter allows for a fine-tuned tool based on historic data, and so avoids losses in accuracy due to the grouping of data. Further work is required to investigate the predictive ability of such a tool, but as an early indication, it’s ability to handle changes in usage are encouraging.
Or, if you’re looking for a grabby headline to take away with you, Graham Gano is really good, Joey Slye is pretty mediocre and 2020 Dan Bailey was really bad, and you now have the data to prove it.
(Top photo via Brandon Todd/Carolina Panthers)