Results and Interpretation
First, let’s look at how the base success rate varies with position and draft years – in this table, the data given is the percentage of players selected in the first round reaching an AV/year of five or more, as discussed in detail on the previous page:
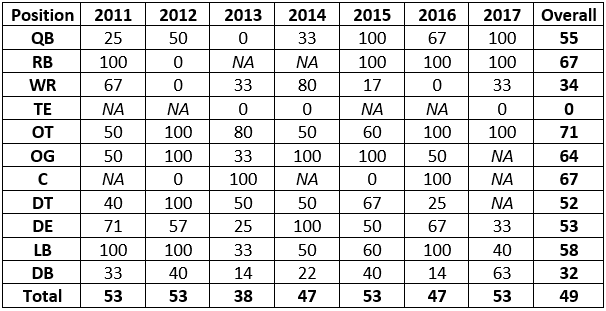
There are several takeaways from this (it is also worth looking at the larger trends rather than focusing on the data from a given year). The first of these largely confirms the data collected two years ago, that while some years are better than others – 2013 isn’t looking any better as time goes on – the success rate broadly fluctuates around 50%, with no year doing better than 55%. It is also worth noting that that the number from two years ago of 53% has dropped slightly to 49%, suggesting that over time the number of players who regress is more than the players who make marked improvements over time.
The other takeaway from this is that the bust rate is much higher for some positions than others.
Interestingly, the positions that are being devalued somewhat by the analytics movement – namely, offensive line and running back – have some of the lowest bust rates, though this could also be due to the teams only being willing to draft players at these positions if they think they are in the very upper echelons.
This is particularly true for the interior offensive line and running back where the overall number of players drafted was notably low. The high success rate for offensive tackles, by contrast, is very interesting.
On the other side of things, there are also some positions where teams have been notably unsuccessful. Tight ends have been a complete nightmare for NFL teams, with every single tight end drafted in the first round between 2011-2017 thus far failing to live up to this standard.
The other positions where NFL teams have really struggled are receiver and defensive back, positions where teams place some of the most importance on athletic measurables – this doesn’t mean that teams shouldn’t draft receivers and defensive backs in the first round, but rather that teams should be more selective about which prospects at these positions merit such a high draft status.
It is also worth looking at these two factors when it comes to the upper tier (AV/year of 7 or more) of draft prospects – remember, these are percentages:
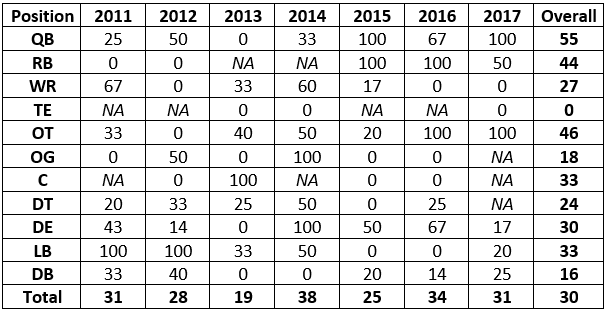
First, and almost inherently, these numbers are much lower than for the first table, which only measures whether a draft pick is a ‘bust’ or not. 2013 is, once again, the worst season – but again, the numbers are all in a vague grouping, with numbers fluctuating around 30% with no year having a rate of 40% or more. Interestingly here, the most effective position is quarterback, suggesting that while the hit rate isn’t that high, when teams do hit, the value is such that they immediately jump into the upper category – likely because first-round quarterbacks are given the chance to play quickly. Whether or not they’re successful in that early play time isn’t so easily measured by AV.
It is also worth noting that guard, a position that has a very low miss rate, also has one of the lower hit rates when it comes to the upper tiers. In other words, very few first round guards bust, but very few are huge successes either. Once again, offensive tackle and running back are also some of the best positions from a value standpoint, and defensive back and tight end are the least reliable positions groups.
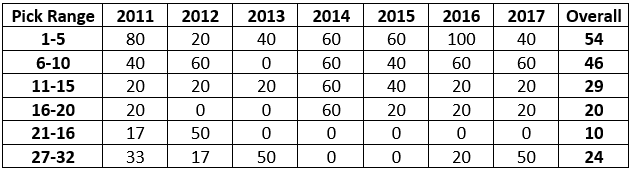
The other thing that is worth considering is how this changes in terms of position in the first round – here’s those with AVs of five or above:
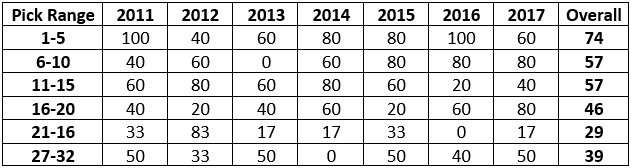
Here, there is one clear and somewhat reassuring trend, namely that the hit rate tends to broadly decrease as the draft goes on (at least for the first round). What is also noteworthy is how quickly the regression happens, with the rate being far higher for top five picks than even picks between six and ten. Some of this might be due to teams giving more playing time to those drafted in the top five whereas those drafted even five picks later don’t get shown the same level of patience.
Here’s those with AVs above seven:
Again, this upper standard shows the same decrease, though it is worth noting that the final six picks of the first round show an upwards bump in both cases. This could either be due to the fact that teams who are competing late in the playoffs show some correlation with teams who are good at drafting, but also that teams trading back into the back end of the first round do so with specific prospects in mind and will tend to do so with a lower risk tolerance than for picks in general.
The data for the last two drafts shows some interesting similarities and discrepancies with the older data. First, the lower hit rate threshold is much, much higher, reaching over 70% for both the 2018 and 2019 drafts. Some of this is likely going to be down to players not yet having time to regress to the mean, which is supported by the fact that the upper hit rates, while on the higher end, are far more in line with the rest of the data set.
This is somewhat supported by the extremely high hit rate for quarterbacks, as while players like Sam Darnold, Josh Allen and Baker Mayfield have all hit the threshold their first couple of years, it is unlikely that all three remain as high-level starters.
However, on the whole, the numbers are broadly in line with the original data set, suggesting that some of the improvement is due to teams moving away from drafting lower-success positions such as wide receiver and defensive backs in favor of offensive tackles and linebackers, which have a much higher success rate.
It will take time to allow these two most recent draft classes to develop before we can start opening the champagne, but it does seem as though teams are getting better at drafting.
This doesn’t necessarily mean they are better at analyzing individual prospects, but have started to take historical data into account when it comes to targeting certain positions at different points in the first round and in the draft in general. Of course, with a data set this small, there is a chance that the next draft class swings wildly back to the other direction, but it does at least seem that this is an area where progress is being made, but what needs to be done to make further improvements, and what does that mean for evaluations?
Up Next: How To Change The Data Set