With the Panthers announcing last week that they have appointed Taylor Rajack, the 27-year old MIT grad who spent five years with the Philadelphia Eagles, to run their analytics department, this signifies that the Panthers are serious about embracing some new ideas in regard to how to run a football team.
This shouldn’t really be a huge surprise given the comments that Panthers owner David Tepper and coach Ron Rivera have made in the past, but there’s a big difference between talking about being innovative and actually innovating.
While the idea of ‘analytics’ is all the rage in modern sports, it isn’t always obvious what this means in practice – and whether it actually will work. So let’s take a moment to have a look at what analytics means in the context of the NFL, how this can help the Panthers, and why some caution is needed in places. Simply put, is this a move to bring the Panthers well into the 21st century, or is this a case of style over substance?
Knowledge is Power
“Working [in Philadelphia], we were very well researched in every decision we made. Trying to gain that edge. We wanted to understand the risks and understand the expectation with any decision to make smarter choices. Why would you ignore information that’s out there? It’s the idea of bringing all the pieces together.”
-Panthers Director of Football Analytics Taylor Rajack
A lot of what people have a habit of referring to as ‘analytics’ is actually just the collection and greater use of data.
While this isn’t something that needs computation, the greater ability for teams to store vast amounts of data in understandable formats has been huge for the way teams are able to approach games. While NFL teams and broadcasters are still trying to work out how to use these stats effectively, situational tendency data in particular allows teams to be more informed in their preparations.
An easy example of this are heat-maps for quarterbacks, which show how a quarterback’s rating varies compared to the league average for throws to different areas of the field. Check out Ryan Fitzpatrick’s chart from partway through 2018:
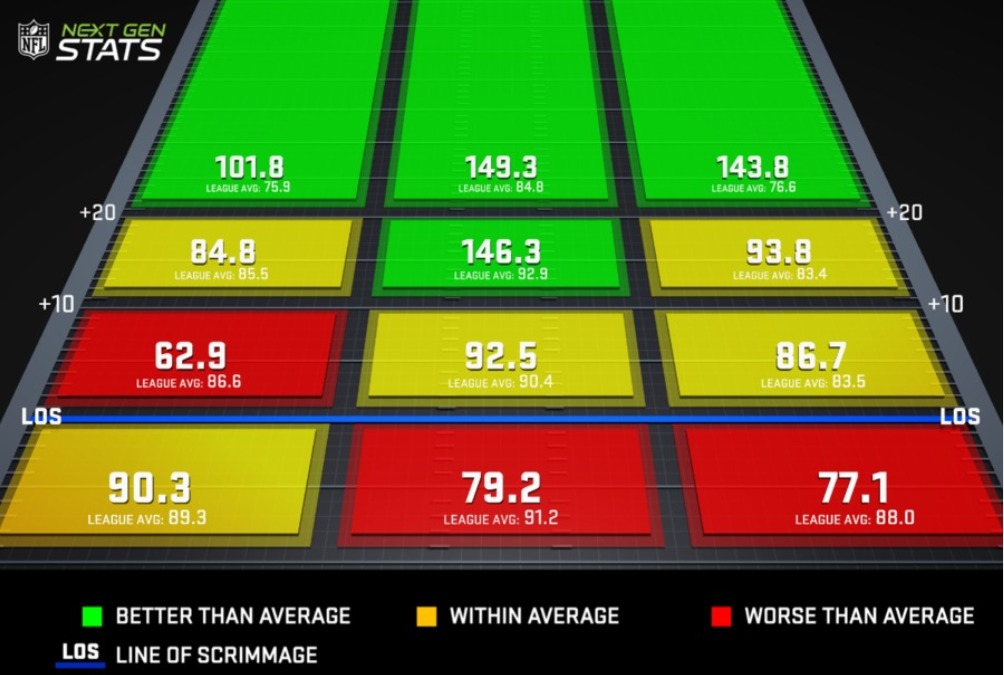
Now as with most statistics, there is a skill not just in being able to crunch the numbers but also in being able to read them in a way that actually translates into something that can be worked on in practice.
There is definitely a risk with numbers like this in trying to over-read the data – focusing in on a single zone and trying and building an argument or plan on that alone – take the short-left zone, for example. If you try and build a game-plan around trying to force Fitzpatrick into throwing to the short left as that’s his worst part of his game, you are failing to see the forest for the trees – by trying to force throws to a particular area of the field, you are likely to distort your defense to the point of breaking and cause your players to be caught trying to overthink every snap.
Instead, the key to data like this – and situational data in general – is to look for general trends rather than focusing on individual data points. For this heat map, for example, the key trend is that Fitzpatrick is far more effective as a deep passer compared to the average NFL quarterback than on shorter passes. Now, this is also something you would likely get as a takeaway from watching Fitzpatrick on tape, but the advantage of stats like this is that they give a macroscopic context that can be missed when watching on a play-by-play basis.
This is obviously something that could be the subject of a much longer piece, but the thing to note here is that a lot of the more basic levels of what is commonly termed ‘analytics’ is actually just the intelligent use of commonly available data.
But that data can also be used to do more than just inform game preparation.
Predictive Statistics
“The thing I’m learning about Taylor and what he brings to the table is that he has some new ideas and different ways to look at the game. He will fit right in with the conversations we’d already started regarding game management and game situations, and he is going to help us as we go forward.”
-Ron Rivera
One of the most common ways in which teams look to use data is when it comes to game management, with historical data being used to work out when it makes sense to go for it on fourth down, when it’s worth risking the field goal and when you should just punt it away or simply when it’s the right time to go for two. The way this works is relatively simple – on a given fourth down, there are two initial options: either you get the first down or you turn the ball over, it doesn’t really matter if the latter comes in the form of an interception or a run that ends a yard short, those are really the only two options.
If you decide to kick a field goal, there are also two main options: you either make it or you miss it. For simplicity’s sake, let’s also assume we’re in the red zone, so the option to punt is moot.
One of these options has a very clear outcome – namely the made field goal, with the value of this outcome being three points multiplied by the probability of making the field goal. Let’s call this 90% for the sake of convenience, which gives the expected points from attempting the field goal as 2.7, but what about going for it on the fourth down?
This is somewhat more complicated, as you have to account for the probability of converting the fourth down as well as the probability of scoring from the resulting first down. What’s more, you don’t know exactly where that first down would be from and you also have to include the probability of subsequently turning the ball over, scoring on the fourth down itself and settling for a shorter field goal. However, all of these quantities can be at least approximated and while I’m not going to go into full details on the calculation for the sake of brevity you might, hypothetically, end up with an expected point value of 3.1, suggesting you go for it on fourth down rather than settling for the field goal, which has a value of 2.7.
This is the most basic form of in-game analytical use.
Of course, these are not things that you want to be calculating mid-game, but data can be used to build informed decision charts which would suggest when coaches should go for it and when they should settle for the field goal. Other examples of when this might be useful are things like when it makes sense to try and return a kick and when you should just take the touchback, when it’s worth trying to score before the half and when it’s time to just take a knee and even more complicated clock-management issues in late-game situations.
However, there is one very big problem with these calculations that needs to be dealt with before we go any further – the idea of error and confidence.
Up Next: When Riverboating Goes Right